Class 11 - Techniques IV - Endogeneity
Agenda
The perils of endogeneity: what, why, when, how (30 minutes)
Application paper discussion (30 minutes)
Break
Replication presentation (15 minutes)
Skills corner - Class walkthrough in R (25 minutes)
General discussion (15 minutes)
The perils of endogeneity
What is endogeneity?
Endogeneity arises when a regressor is correlated with the error term, thereby violating the most important OLS estimation assumption, the exogeneity condition, specifying that u has an expected value of 0. (Bascle 2008, 288)
One source you are familiar with - spurious correlations
https://www.tylervigen.com/spurious-correlations
What is endogeneity?
Nomological network view:
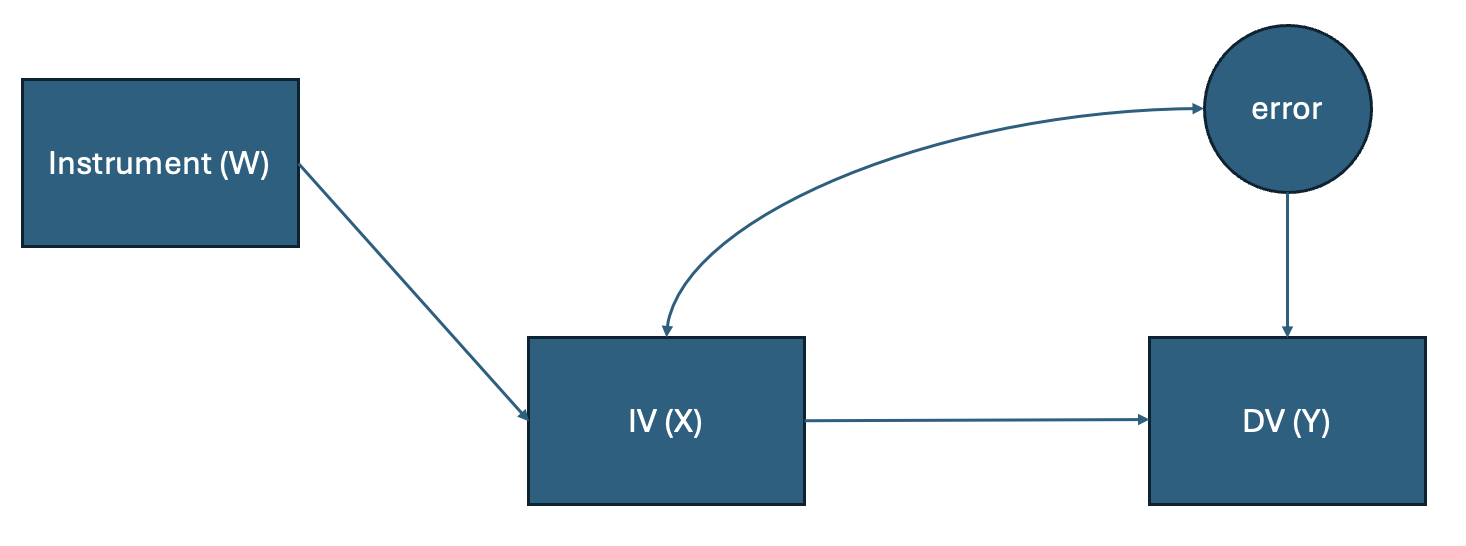
Regression model view:
\(Y = \beta_0 + \beta_1X + \epsilon\); \(E[\epsilon|X \ne 0]\)
Why is endogeneity problematic?
A theoretical problem
We fail to capture the underlying dynamics of the process
We draw the wrong conclusions from our analyses about which variables matter or the direction of causal flow
An empirical problem
We cannot recover causal effects due to a lack of “identification”
We may not even be able to come up with estimates at all if the model is structurally unidentified (e.g., supply and demand models)
Our effect estimates can be significantly biased, and even in the wrong direction without correction
What issues can cause endogeneity?
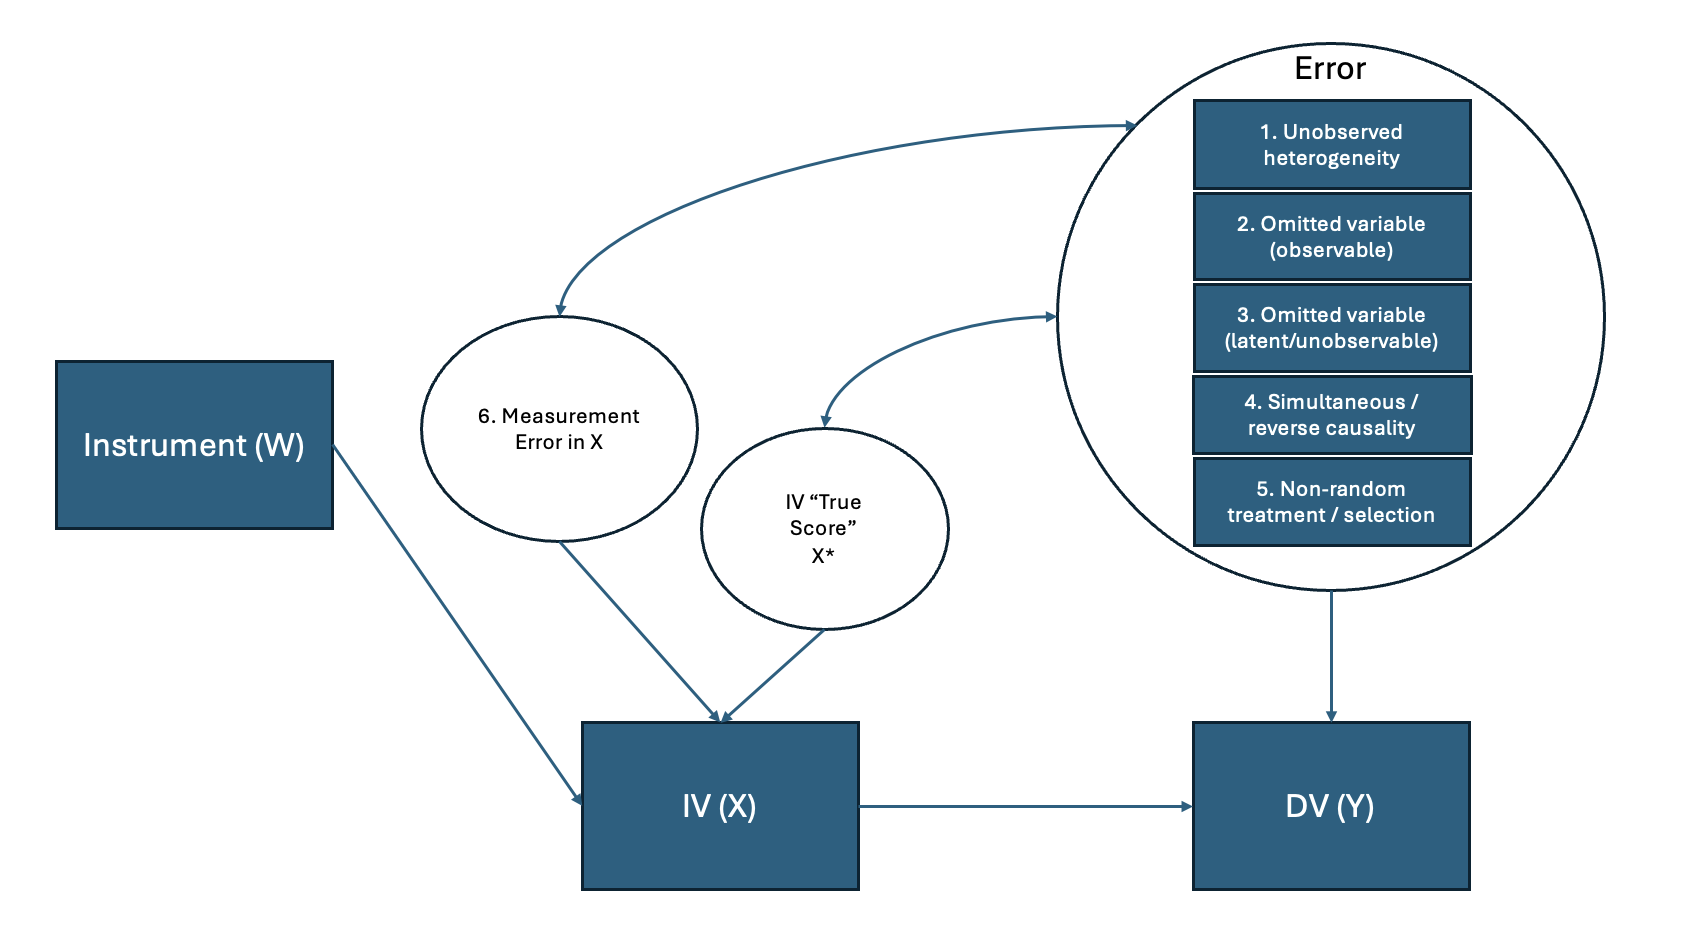
What issues result in endogeneity?
Unobserved heterogeneity: Individual idiosyncratic deviations from the overall mean of the DV in a manner that is correlated with the IVs (e.g., firm “quality” likely correlates with size)
(Observed) omitted variable: We have left out an observable variable (omitted variable, OV) that is correlated with the IV and DV (e.g., OV = average temperature, IV = gunshots, DV = ice cream sales)
(Unobserved) omitted variable: We have left out an unobservable variable that is correlated with the IV and DV (e.g., IV = study hours, DV = GPA, OV = g (general mental ability))
What issues result in endogeneity?
Simultaneous / reverse causality: either we have the direction of causality wrong (Y -> X) or they cause each other / are codetermined (X <-> Y) (e.g., price and quantity in a market setting)
Non-random selection in groups: Individuals self-select into a state or treatment or there are differences in surivival or attrition (e.g., IV = hospitalization, DV = general health, selection effect = need for treatment)
Measurement error in X: We cannot measure X perfectly, which at a minimum attenuates the relationship between X and Y, but if the measurement error in X is correlated with Y, we come back to the omitted variable bias problem
How can you correct for endogeneity?
Approach 1: Isolate exogenous variation in X
Instrumental variables (IV) / Two stage least squares (2SLS): Can address all of these issues, but finding relevant and exogenous instruments is tough (Bascle 2008)
Heckman selection / Tobit-2 / Tobit-5 models: Can address (5), possible to perform using functional form alone but stronger when with an exclusion condition (i.e., an instrumental variable)
How can you correct for endogeneity?
Approach 2: Excise or extract endogenous elements from e
Include omitted variables: Can address (2), the essence of adding control variables to a model (Carlson and Wu 2012)
Fixed effects panel specifications: Can address (1),(2),(3) if the OVs are [time invariant], but can exacerbate (6) (Bascle 2008)
Dynamic model specifications: Can address (2) (3) (4), but caution required since this can introduce other endogeneity problems, especially with panel data (known as the Nickell bias)
How can you correct for endogeneity?
Approach 3: Punt on fixing and instead assess threat to inference
Impact Threshold of Confounding Variables (ITCV) and Robustness of Inference to Replacement (RIR) ask the question: How big of a confounding effect would an endogeneous problem need to have to overturn the inference in a model where it is not modeled?
This can be a nice tool to have in the back pocket for reviewers
Analyzing data in the presence of endogeneity
How do you perform a (basic) endogeneity analysis?
Proactively identify the potential cause(s) of endogeneity.
Run your models in a typical fashion.
Run alternative models (discussed above) that are consistent in the presence of endogeneity (example of 2SLS on next slide).
Use appropriate tests to determine which model is preferred (e.g., Durbin-Wu-Hausman, exogeneity, relevance tests). (Bascle 2008)
Perform typical statistical inference based on the preferred model.
It often helps to report test statistics, and space permitting, the results from alternative models to give the reader confidence in the robustness of the results.
Example: Running 2SLS
(Hard part) Find instrument(s) for each of your endogenous variables.
If you are lucky enough to have an embarrassment of riches with multiple instruments for each, use them so you can test for exogeneity!
Verify the instruments are sufficiently strong (e.g., first stage F test)
Run the 2SLS procedure (next slide)
Example: Running 2SLS
What is 2SLS doing? In essence, the following1: \(Y = \beta \hat X + e\)
Such that: \(\hat X = W\hat\delta\)
And \(\hat\delta = (W^TW)^{-1}W^TX\)
Where W is the set of the exogenous variables + instruments, and X is set of exogenous and (instrumented) endogenous variables.
This procedure “purges” X of its endogenous part and only relies on the exogenous variation present in W.
Why not just use the models robust to endogeneity always?
Multiple endogeneity issues: each may require non-compatible solutions.
No free lunch: models robust to endogeneity pay a price (typically small-sample bias and efficiency).
Many endogeneity tests compare two estimators - one that accounts for endogeneity and one that does not.
If the test fails, endogeneity is a problem and you need to use the estimator that is “consistent” in the presence of endogeneity.
If the test passes, it is better to use the ‘standard’ estimator: it is has more power and is more precise (tighter sampling distribution).
Applications
Application readings
Let’s level-set people’s familiarity with these pieces.
Bascle, G. 2008. Controlling for endogeneity with instrumental variables in strategic management research. Strategic Organization 6(3): 285-327.
Fox, B. C., Simsek, Z., & Heavey, C. 2023. Venture team membership dynamics and new venture innovation. Strategic Entrepreneurship Journal.
Bascle (2008)
What was this paper about?
What were the findings?
What was the method?
What makes sense? What was confusing?
Fox Simsek and Heavey (2023)
What was this paper about?
What were the findings?
What was the method?
What makes sense? What was confusing?
Break
Replication Presentation
- Replication: Fox, B. C., Simsek, Z., & Heavey, C. 2023. Venture team membership dynamics and new venture innovation. Strategic Entrepreneurship Journal.
Class walkthrough in R
Preparation for next class
Next class
Your draft paper is due before we meet for our final workshop and the final paper is due by May 3.
Next class
Design I: Quasi-experimental data
Grant, A. M., & Wall, T. D. 2009. The Neglected Science and Art of Quasi-Experimentation. Organizational Research Methods, 12(4), 653-686.
Shadish, W. R., & Cook, T. D. 2009. The renaissance of field experimentation in evaluating interventions. Annu Rev Psychol, 60, 607-629.
Next class
Design I: Quasi-experimental data
Applications:
Shu, L. L., Mazar, N., Gino, F., Ariely, D., & Bazerman, M. H. (2012). Signing at the beginning makes ethics salient and decreases dishonest self-reports in comparison to signing at the end. Proceedings of the National Academy of Sciences, 109(38), 15197–15200. doi:10.1073/pnas.1209746109 (see also https://datacolada.org/109)
Replication: Penrosian capacity as a constraint on entrepreneurial growth: An exploratory study employing the dot-com bubble (working paper)
References
References
Footnotes
Don’t run this yourself since the standard errors will be wonky! Use the output from the software which makes the necessary corrections. Also note that in regular OLS, X “instruments” for itself.↩︎