Class 13 - Design II - Longitudinal
Agenda
Longitudinal designs: what, why, when, how (30 minutes)
Application paper discussion (30 minutes)
Replication presentation (20 minutes)
Skills corner - Class walkthrough in R (25 minutes)
General discussion (10 minutes)
Break then concluding remarks
Longtudinal designs
What is a longitudinal design?
Taking all the above into consideration, we define longitudinal research as research emphasizing the study of change and containing at minimum three repeated observations (although more than three is better) on at least one of the substantive constructs of interest. (Ployhart and Vandenberg 2010, 97)
Why are longitudinal designs useful?
[S]trategy researchers have not fully capitalized on the fact that longitudinal data are multilevel in nature. Longitudinal data include two types of variance: within-unit (e.g., within-firm, within-person, etc.) and between-unit (e.g., between-firm, between-person, etc.) variance1. These two types of variance correspond to two different relationships: within-firm and between-firm relationships. (Certo, Withers, and Semadeni 2017, 1536)
How can you design a longitudinal study?
A multitude of potential designs
Growth curve modeling (Ployhart and Vandenberg 2010)
Moderation by causal cycle (Mitchell and James 2001)
Panel methods (Certo, Withers, and Semadeni 2017)
Dynamic panel models
Dynamic SEM models (e.g., cross-lagged panel models)
Time series modeling (ARIMA, GARCH)
Markov chain monte carlo (MCMC)
Stochastic differential equations (SDEs)
A basic workhorse: Panel data estimation
Panel data methods exploit within and between entity variance, and blend some of the benefits of cross-sectional and time series designs
Fixed effects estimators are also consistent in the presence of unmeasured or unobservable confounding variables that are time invariant for the period of analysis (e.g., general mental ability, firm quality, etc.)
A basic workhorse: Panel data estimation
\[Y_{it} = \beta X_{it} + \nu + \epsilon\] There are basically two key questions in a typical panel data setup:
Can the data across time be pooled (essentially is \(Var(\nu)=0\))?
Is the idiosyncratic error for each entity uncorrelated with the regressors (is \(E(\nu|X)=0\))?
If the first is true, we can used “pooled OLS”. If the second is true, we can use “random effects”. Otherwise, we need to use “fixed effects”.
Three ways to get to a fixed effects estimator
Include a dummy variable for each entity
The “within” transformation - subtract the mean from every observation
First differencing - take a one period difference between each observation
They will typically provide the same answer but there can be differences (particularly for the first difference operator) if there are multiple panel waves and the changes over time fluctuate about the overall average
An alternative workhorse model: Lagged dependent variables
\[Y_{it} = \beta X_{it} + \theta Y_{it-1} + \epsilon\]
Here, the model can be interpreted two ways:
X predicts the incremental change in Y
Y is predicted by its past history, which means:
all of the X variables have a multiplier effect proportional to the coefficient on Y, and
the error term likewise propogates through time
(Note it is also possible to have a model where errors are autocorrelated but there are no dynamics) (Keele and Kelly 2006)
Why not just use fixed effects and lagged DVs?
In short, the assumptions conflict.
The conditions for consistent estimation of this model are much more demanding than those required with fixed effects or lagged dependent variables alone. […] The problem here is that the differenced residual is necessarily correlated with the lagged dependent variable because both are a function of the fixed effect in the prior period (Angrist and Pischke 2008, 183).
There are lagged panel models that incorporate instrumental variables, but they chew up several years and have the typical issues of small-sample bias.
Not all hope is lost
[W]hat ís an applied guy to do? One answer, as always, is to check the robustness of your findings using alternative identifying assumptions. That means that you would like to find broadly similar results using both models. Fixed effects and lagged dependent variables estimates also have a useful bracketing property. (Angrist and Pischke 2008, 184)
Also, with a long enough time panel (as \(T \rightarrow \infty\)), the magnitude of the Nickell bias becomes smaller (Baum 2013) (but its not a perfect solution since convergence is \(O(1/T)\)).
Why I am focusing on these two models?
Between them, they are able to address many of the endogeneity problems discussed in Week 11
They also capitalize on within- and between- entity variation and can be generalized using tools like RCM and the like
The drawback is their continued grounding in a regression-type framework which may not fully capture some of the nuances of longitudinal study or at a minimum impose some substantial assumptions
Quick note on terminology
Panel data econometrics uses different terminology than statistics and other social sciences. Here is the (loose) translation guide.
| Model | Econometrics | Statistics |
|---|---|---|
| \[Y_{it} = \beta X_{it} + \alpha_{i} + \epsilon_{it}\] | Fixed effects | LSDV (Least squares dummy variable) |
| \[Y_{it} = \beta X_{it} + \nu + \epsilon_{it}\] | Random effects | Fixed effects |
| \[Y_{it} = \beta_i X_{it} + \nu + \epsilon_{it}\] | Random coefficient modeling (RCM) | Random effects |
Confusing I know… this is what happens when different fields derive similar methods independently.
Applications
Application readings
Let’s level-set people’s familiarity with these pieces.
Certo, S. T., Withers, M. C., & Semadeni, M. 2017. A tale of two effects: Using longitudinal data to compare within- and between-firm effects. Strategic Management Journal, 38(7), 1536-1556.
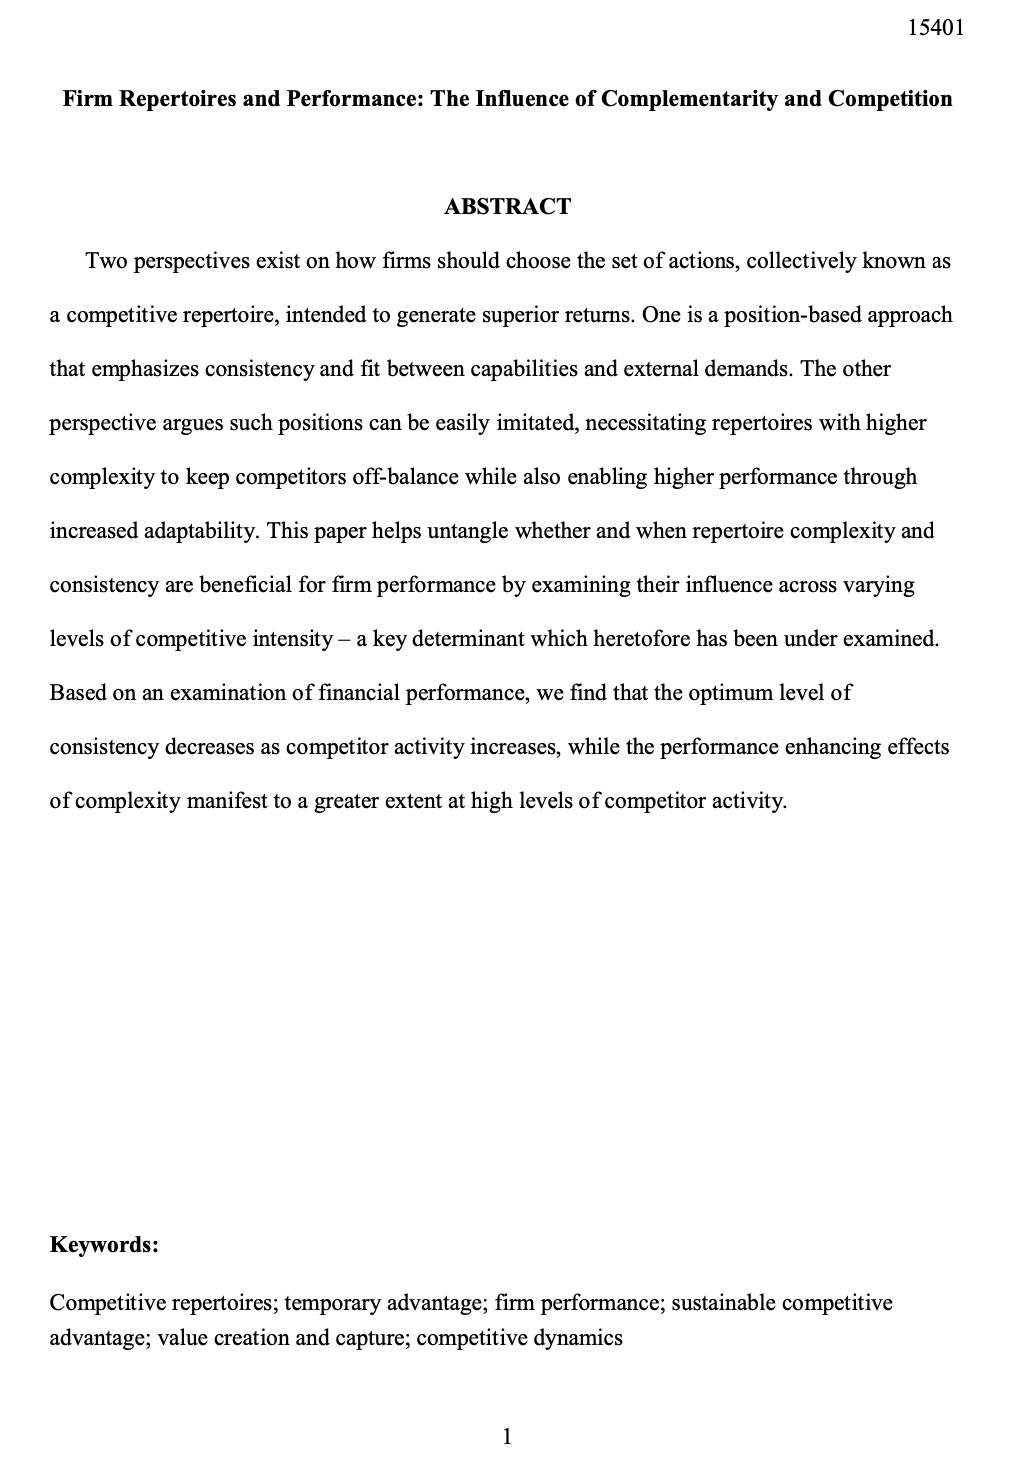
Firm Repertoires and Performance: The Influence of Complementarity and Competition (working paper)
Certo Withers and Semadeni (2017)
What was this paper about?
What were the findings?
What was the method?
What makes sense? What was confusing?

Fox Simsek and Souder (working paper)
What was this paper about?
What were the findings?
What was the method?
What makes sense? What was confusing?
Break
Replication Presentation
Replication: Firm Repertoires and Performance: The Influence of Complementarity and Competition (working paper)
Skills corner - Class walkthrough in R
Preparation for next class
Next class
Concluding remarks
Final paper working session